More privacy friendly options to measure your electricity use
Many countries, such as the Netherlands, are pushing for people to install so called 'smart meters'. They offer the advantage that you no longer have to send in the levels once a year. They contain simple phones that transmit the data back to your electricity provider.
Why you should care
What most consumers don't realise is that having 'live' insight into how much electricity your home uses can reveal a lot more about you than you may expect. Using so called "power disaggregation algorithms" (also known as "non-intrusive load monitoring"), it is possible to figure out which devices you own and when you use them. This is because each device has a unique electricity consumption fingerprint. For example, your fridge will have a very distinct repeating pattern, with a very distincy power level. If you look at the image above, in the top graph, you can see an LG microwave oven heating up and the baking something.
Using these algorithms it is possible to puzzle together which devices you own and when and how often you use them. Over time, even the use of small devices can be detected.
These patterns can reveal a lot about your lifestyle. Obviously this data reveals when you go to bed and how long you sleep. It reveals how frugal you are. It reveals when you are home, when you have people over, It reveals which devices you own, and that says something about your income level. It reveals how often you buy new devices, and so forth.
A next step is to compare your patterns with those of other people. For example, if your patterns resemble those of people with a certain political or religious persuasion, or a certin health catgory, then a prediction could me made that you belong to a similar group.
The solution
The best way to avoid these algorithmic judgements and comparisons is to make sure your data never leaves your home in the first place. The only way to be sure your data isn't transmitted and your behaviour isn't analysed is to not got a meter that has these capabilities in the first place.
But it's can still be valuable to have insight into your electricity use yourself. That's why there are two updates to Candle's ability to measure your electricity consumption.
1. Updated Energy Use Sensor
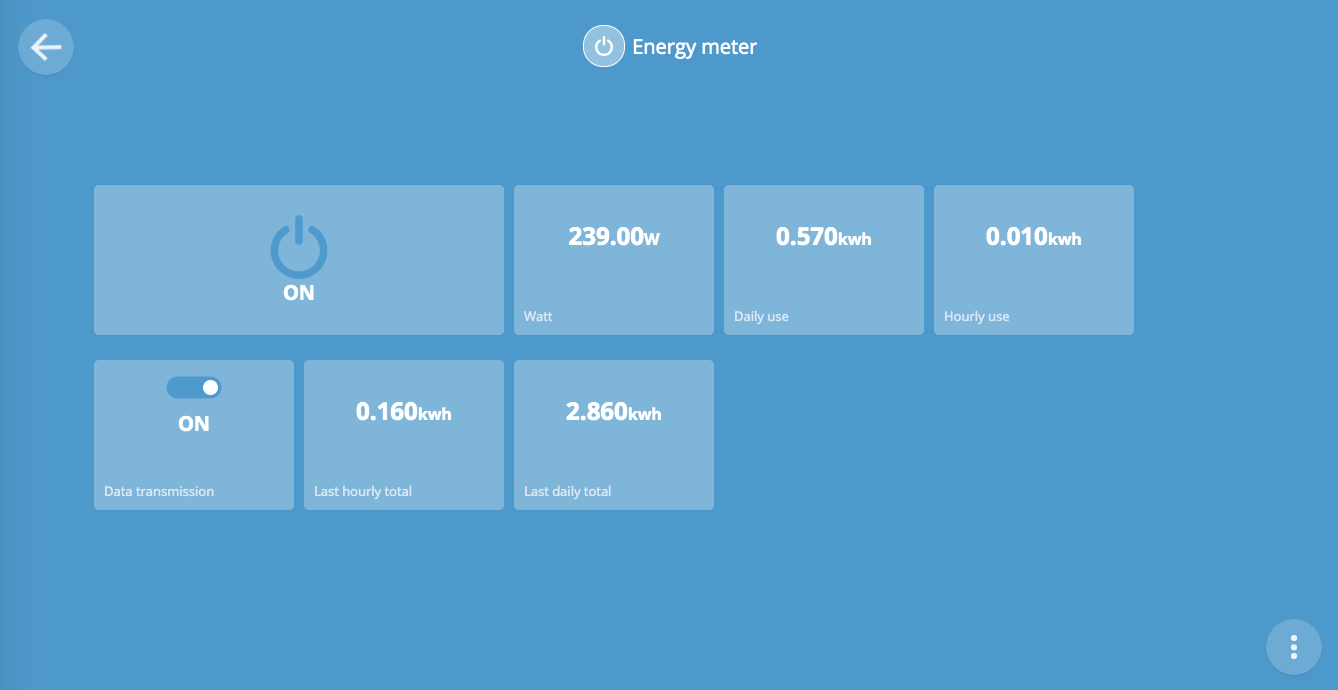
The Candle Energy Use sensor has been upgraded this week. The open source code is available on Github.
The sensor now generates more types of data:
- Live consumption (in Watt). It's the top graph in the image. It allows you to see how much watts your home is consuming at this very moment. The sensor already had this.
- Hourly live consumption. This is constantly updated. It makes it easier to compare hourly usage during the day. It makes it easier to spot if you use more power in the evening, during cooking, for example. You can see this in the bottom graph in the image above. The sensor already had this.
- NEW Daily live consumption (in Kwh). As the day progresses, the total Kilo Watt Hours consumed is recorded. This is constantly updated.
- NEW Hourly consumption total (in Kwh). This is the same as above, but it's not live. It only records the total at the end of the hour. This is for privacy reasons we'll get back to.
- NEW Daily consumption total (in Kwh). This only reveals the total consumption at the end of the day. Again for privacy reasons.
Like most other Candle devices, the energy use sensor now has a data transmission switch. It allows you to disable the transmission of live data at any time. When data transmission is disabled, only the hourly and daily totals will still be recorded. When you disable data transmission you can still gain insight into electricity consumption, but it makes it harder to see exactly which device is switched on when and for how long. Especially the use of smaller devices is hidden.
For example, this makes it harder to know if a child was using the computer to do homework, or was lazily watching the TV. It makes it harder to tell if a stereo system was playing music after bed time, although energy consumption after bed time would still be recorded at the end of the hour. It creates the kind of plausible deniability that children need to develop into healty, mischievous adults.
Talk to the people in your home, and together figure out when you want highly detailed data, and then you do not. Similarly, look for consensus on what data should be logged, and for how long.
2. Creation of the P1 addon
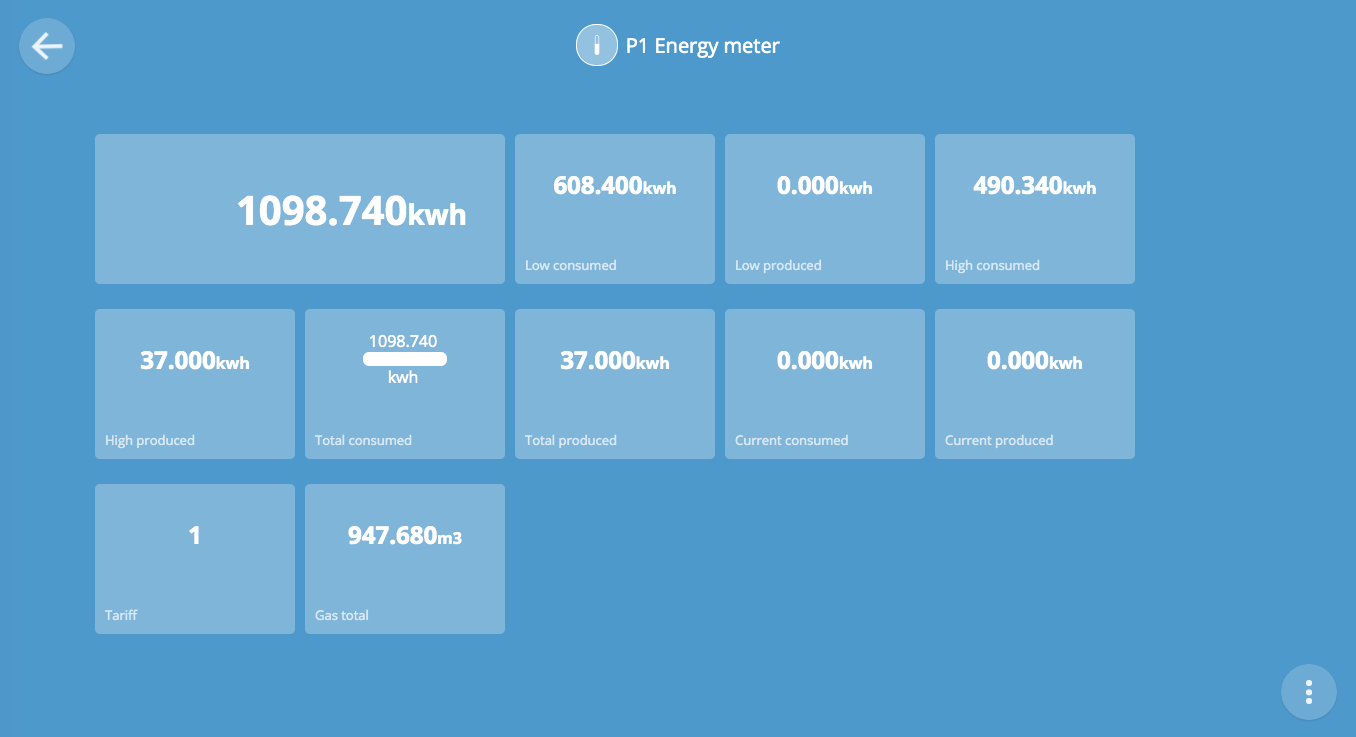
Many Dutch and Belgian homes do have a smart meter. By law, all these devices come with a so called "P1" port, which allows you to read the live values from the meter yourself too. Many smart home enthousiasts use this ability to keep track of their energy consumption.
We've created a new addon that allows you to read this data into the Candle system (which is essentially the Mozilla WebThings Gateway system with extra privacy features).
One advantage of the P1 addon over the Candle Energy Use Sensor is that it can also offer insight into energy generation. For example, if you have solar panels, you can now see and graph how much electricity these panels are generating.
If your smart meter also measures gas consumption, you can now read and log that as well.
This code has been made open source, as usual, so you can check out how it works and what it does if you are so inclined.
Share this article
These are privacy friendly sharing buttons; no code from these companies has been loaded into this page